How to Read Your ServiceLeo Analytics
A complete guide to your analytics dashboard.
Alex Chen
Customer Success
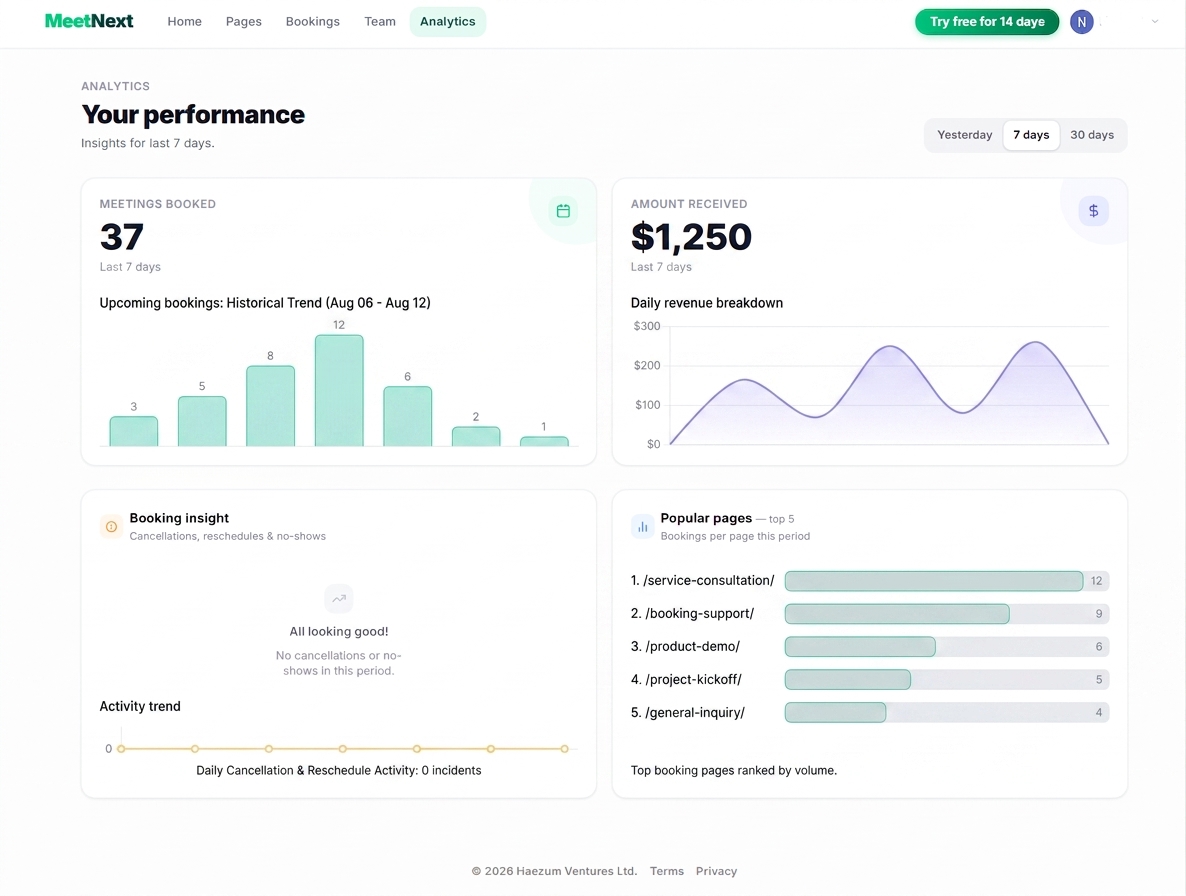
Your ServiceLeo Analytics dashboard gives you a real-time, at-a-glance view of how your booking business is performing — meetings booked, revenue collected, appointment health, and which pages are driving the most traffic. Here is exactly how to read each section.
The Timeframe Selector
In the top-right corner of the dashboard you'll find three period tabs: Yesterday, 7 days, and 30 days. Every metric, chart, and total on the page updates instantly when you switch periods — making it easy to compare a single day against a week or a full month without any manual filtering.
💡 Tip: Use Yesterday for a quick daily health check, 7 days to spot weekly patterns, and 30 days for month-over-month trend analysis.
The Four Dashboard Panels
Below the timeframe selector, the dashboard is split into four panels arranged in a two-by-two grid. Each panel focuses on a distinct dimension of your scheduling performance.
Meetings Booked
Tracks the total number of appointments confirmed in the selected period. The large headline number gives you an instant read on demand — no digging required.
Amount Received
Ties your scheduling volume directly to cash collected. If you have Stripe connected and charge for appointments, this panel tells you exactly what you earned.
Booking Insight
Monitors the reliability of your schedule by tracking cancellations, reschedules, and no-shows — the three events that erode revenue without removing time from your calendar.
Popular Pages
Ranks your top 5 booking pages by appointment volume for the selected period — giving you a clear picture of which services are driving the most demand.
Putting It All Together
The four panels are designed to be read together, not in isolation. A spike in Meetings Booked should show a corresponding lift in Amount Received. If it doesn't, check whether those bookings came from free or unpaid appointment types. If Booking Insight shows a sharp spike on the same day as a bookings peak, you may have a specific appointment type that attracts unreliable clients — worth reviewing your cancellation policy or requiring a deposit.
💡 Pro move: Check Popular Pages at the end of each month and double down on your top performer — share its link in your email signature, social bio, and website hero — to compound its results in the next period.
Put this into practice with ServiceLeo
Set up your first booking page in 10 minutes. Free forever, no credit card required.
Start for free